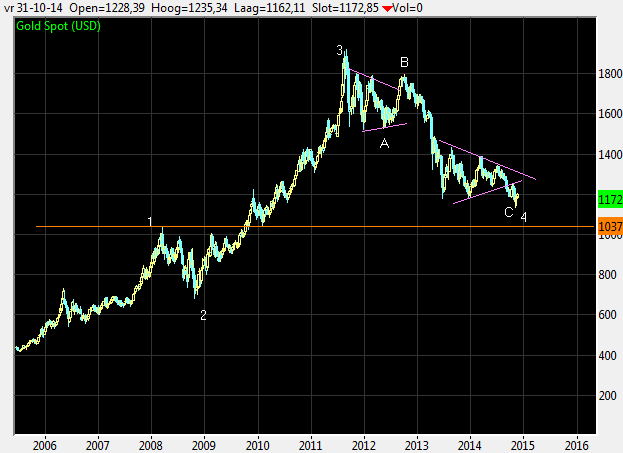
Looking at the gold spot chart I notice the correction gold is going through (3 to 4) on the huge rally as from end 2008 to 2011 (2 to 3). As long as gold stays above the top of $1032 in 2008 (marked 1) this ABC-correction counting stays valid. The last couple of weeks I can see the market forming a bottom around $1150. When I zoom in it shows as follows:
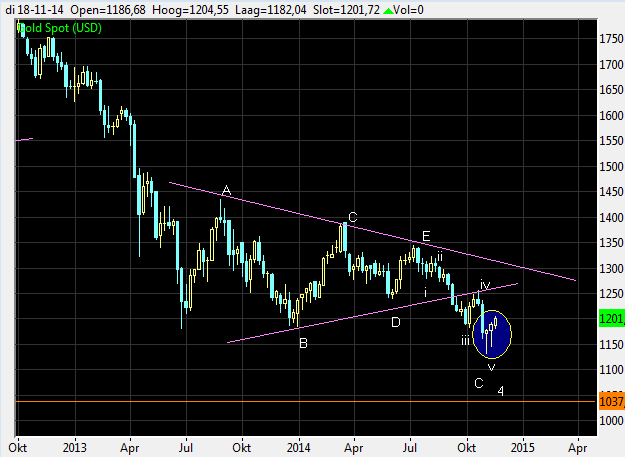
The last fraction of C (of the ABC-correction) shows a ABCDE triangle. The last leg down i to v looks like to be complete. Looking at the candles of last weeks the market is making a bottom (blue circle). If the market succeeds to go through the resistance of the $1200 (bottoms june and december 2013) the beginning of the way up to above the top around $1850 in 2011 might be there.