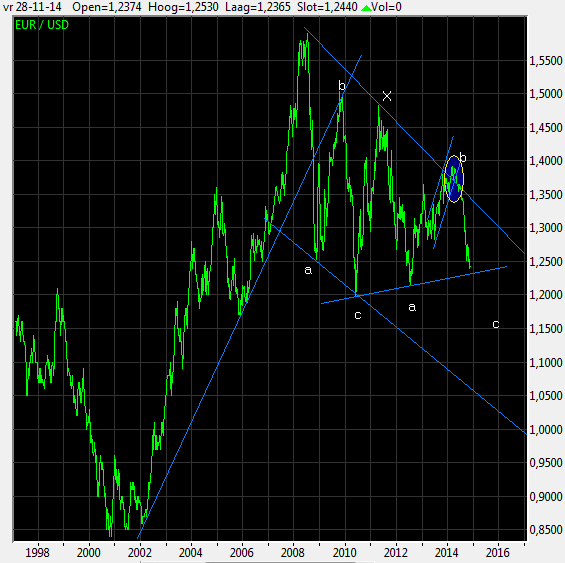
As from the moment the euro currency was available as method for payment in January 2002, it rose from 85cts against the USD to 160cts in July 2008. As a reaction to this impulse, the EURO is making a sideways correction around 135cts +/- 15cts roughly for some years now. Looking at the shape of this correction I see a zigzag pattern of which the latest leg is being formed downwards as from 140cts in May this year. At that moment there was a false breakthrough through the descending trendline over the tops (blau circle) and as a reaction to this the currency made a big dive. I expect the EURO to find temporarily support around current level due to the ascending blue trendline. As soon as this support breaks, levels of 120/115cts can be expected, if not lower.
Maandelijks archief: november 2014
DAX ANALYSIS
The development in the DAX is worthwhile publishing an analysis today.
To begin with, the chart shows an impulse rise as from September 2011. After years of zigzagging the index rocketed through the descending trendline over the tops B and D (where the AEX still finds resistance as per my AEX analysis underneath). This impulse rise can be counted as 5 waves with wave 5 yet to be finished.
Zooming in I see that, compared with the CAC40 (see my analysis underneath) the DAX went through the descending green trendline of recent tops already. Looking at the RSI, I see that also there the red line of resistance has been crossed. A sign that current line is with relatively big power. Yet the all time high of june this year of around 10050 is waiting to be taken out soon. Looking at the chart, I expect this to happen coming weeks as the impulse started in 2011 is not yet finished. Wave 5, started in October, is now in subwave III with wave IV and V still te come.