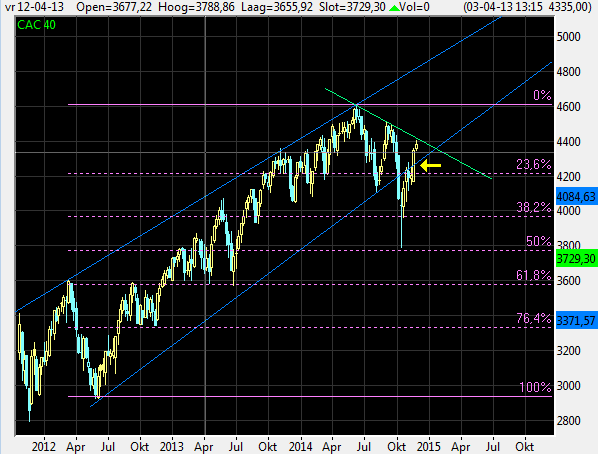
Today my update on the CAC40. I write this update due to a change my expectation of the direction of this index. This change is caused by the move of the index last week. The index moved back within the uptrend (blue lines) where a move sideways or down was expected. This move up of last week (see yellow arrow) was triggered by (announced) action of two central banks. Technical analysts usually say that all news is discounted within the indices but actions by a central bank with the intention to influence the market, is, if you ask me, not news that you may consider as discounted in the index. Mario Draghi, president of the ECB, announced at the European Banking Congress last Friday 22 November that he is determined to drive up inflation as quick as possible and China’s central bank announced lowering her interest for one year loans and deposits. Looking at the chart now I see an index back in the trend but with resistance of the green descending line over earlier tops. Which one is going to break? Due to the upside momentum I reckon the green one will be broken with a big chance that the index will re-visit the high of around 4600 pts of june this year. For trading action it is better to wait and see until the picture is clear.