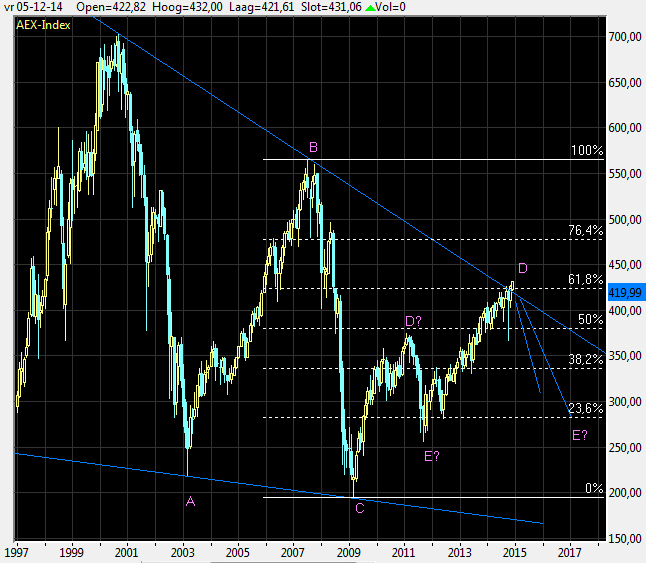
In my previous analysis I stated that I found it likely that top D had been placed as the descending trendline and the Fibonacci 61.8% correction level should keep the index from going higher. Nevertheless, November closed above these lines. As it was with five points only, it is a little bit looking on a monthly basis. Was it to little or enough for onward rise? December will give more insight in that question. Is there something to say about December yet? Looking at the weeklychart I see the following:
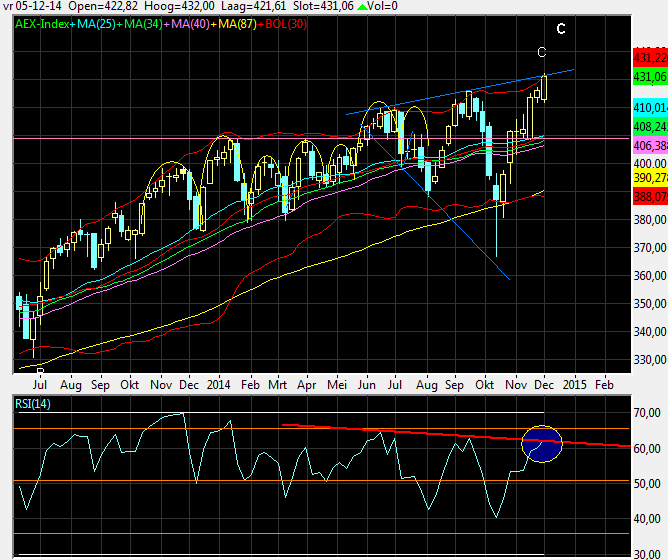
The RSI (blue circle), the blue upper rising trendline and upper Bollinger band line should give resistance the present rise. Zooming in on a daily basis a nice pattern is forming.
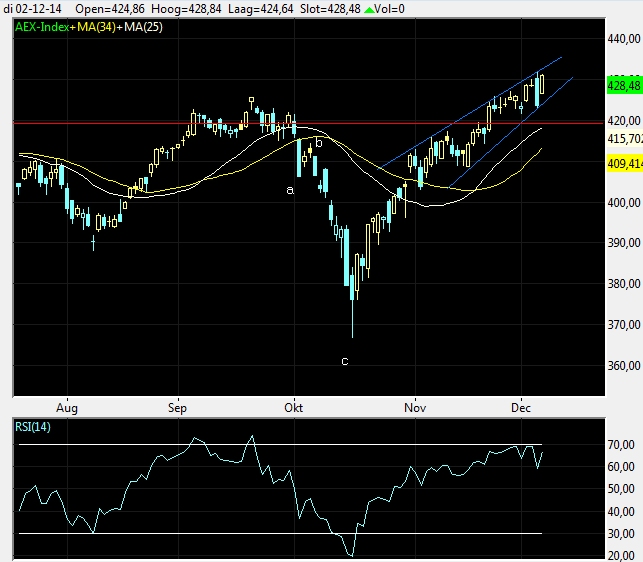
The blue trendlines show an ending diagonal triangle. This pattern indicates the index is in the last phase of the rising trend and once leaving this pattern on the downside, it can fall back to the basis of the triangle between 400pts and 410 pts
To conclude I can say that on a longer term basis it looks like that the AEX can continue its rise to 480pts (the 76.4% Fibonacci correction level or 560pts (the previous top of 2007). However, if the breakthrough of the longterm descending trendline and 61.8% Fibonacci trendline in the monthly chart appears to be false, which can not be disregarded looking at the weekly- and dailychart, a fall to 340-280 is still possible.